
Bitcoin experienced a commendable week, with its prices climbing approximately 10% to attain the psychologically significant milestone of $30,000. As this rally unfolds, investors grapple with the pressing question of whether this bullish trajectory will persist or if a reversal is imminent.
The proficient trading team at Stockmoney Lizards recently posited that Bitcoin may imminently breach its overarching resistance level, inciting a vigorous upswing. Their rationale is grounded in the belief that the approval of an exchange-traded fund will fuel widespread adoption and trigger the rally, particularly in anticipation of the impending halving in April 2024.
An encouraging development unfolded this week as Bitcoin’s strength cascaded onto various alternative cryptocurrencies, causing them to surge beyond their respective resistance thresholds. This shift in sentiment is gradually evolving into a positive outlook, prompting consideration of selective investments.
Historically, the coins that lead the market’s ascent are those most likely to flourish, while the laggards often lag behind and may be judiciously sidestepped initially.
Now, let’s delve into the charts of the top five cryptocurrencies that are poised for exceptional performance in the near future.
Bitcoin Price Analysis-
Bitcoin currently finds itself in a pitched battle between bullish and bearish forces in the vicinity of the $30,000 mark. Notably, the bulls have steadfastly maintained their ground, showing a reluctance to concede much territory. This consolidation around the present level signals the bulls’ anticipation of another upward leg, potentially propelling the price into the resistance zone spanning from $31,000 to $32,400.
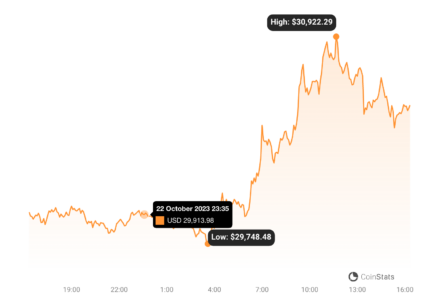
https://coinstats.app/coins/bitcoin/
Conversely, if the price retraces from the $31,000 mark, the BTC/USDT pair may dip to the 20-day exponential moving average at $28,160. Should the price recover from this level, the bulls will, once again, endeavor to overcome the overarching hurdle.
The optimistic sentiment would be undermined by a breach below the 20-day EMA, potentially trapping the pair within the $31,000 to $24,800 range for an extended duration.
Upon close examination of the 4-hour chart, the pair’s ongoing ascent typically encourages traders to “buy the dip” at the 20-EMA, reflecting the prevailing bullish sentiment. If this pattern materializes, it will signify that bullish enthusiasm remains intact, with each minor dip promptly attracting buyers. Such a scenario could pave the way for the pair to continue its ascent toward $32,400.
In contrast, should the price dip below the 20-EMA, it may indicate that traders are hastily exiting their positions, which, in turn, might herald a further decline toward the critical support level at $28,143.
Solana Price Analysis-
Solana made a decisive breakout on October 19, marking the culmination of a bullish inverse head and shoulders pattern. This pattern projects an objective of $32.81. Notably, the relative strength index (RSI) currently registers overbought levels, hinting at the potential for a corrective move.
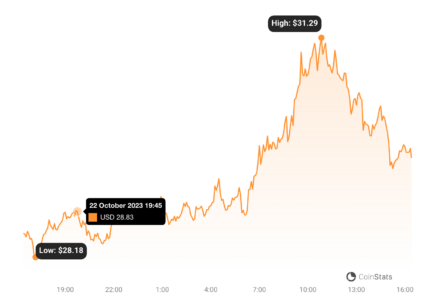
https://coinstats.app/coins/solana/
On the downside, the pivotal support level stands at $27.12. A resolute rebound from this support would signify the bulls’ ability to convert it into a support level, further reinforcing the prospects for an ongoing uptrend. Beyond $32.81, the rally could extend to $39.
Time is of the essence for bearish forces. To impede the upward trajectory, they must swiftly drive the price beneath $27.12. Such a move would suggest that the prior breakthrough above $27.12 may have been a false breakout, adding a layer of significance to this critical level.
A closer examination of the 4-hour chart reveals the formidable resistance the bulls face around the $30 mark, a challenge that could potentially trigger a retracement to the breakout level at $27.12. Investors can anticipate robust efforts by buyers to defend this level, should it come under siege. A resounding rebound from this juncture may indicate the continuation of the bullish move.
Conversely, if the price pivots lower and breaches $27.12, it would signify aggressive selling by bears at elevated price levels, potentially sending the pair plummeting toward the neckline at approximately $24.50.
Chainlink Price Analysis-
Chainlink has exhibited a protracted period of trading within a narrow band, confined between $5.50 and $9.50 since May 2022, signifying a state of equilibrium between supply and demand.
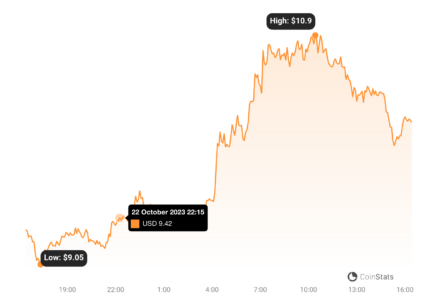
https://coinstats.app/coins/chainlink/
Despite the bulls’ attempts to breach this range to the upside on October 22, a long upper wick on the candlestick reflects the steadfast resolve of bears. If the bulls can hold their ground at current levels, it will bolster the prospects of an upswing beyond $9.50.
In such a scenario, the LINK/USDT pair may embark on a journey toward the pattern target of $13.50. Breakouts from prolonged consolidation phases often result in sharp rallies, suggesting the potential for an uptrend stretching to $15 and, subsequently, $18.
The initial line of defense on the downside rests at $8.50. A descent below this level would indicate that the range-bound action may endure for a considerable duration.
The pair’s 4-hour chart reflects a vigorous rally from $7.50, which propelled the RSI into overbought territory. This could signal that the rally has extended into overbought territory in the near term, potentially foreshadowing a retracement or consolidation.
Notably, the primary support levels on the downside stand at $8.75, followed by $8.50. A robust rebound from this zone would signify the endurance of positive sentiment, with traders buying on dips, thereby increasing the likelihood of a retest of $9.75.
However, a break below the 20-EMA would signify the resurgence of bearish sentiment, potentially driving the pair down to $7.
Aave Price Analysis-
Aave experienced a breakthrough on October 21, transcending the bearish descending triangle setup. Often, the failure of a bearish setup paves the way for a bullish trajectory.
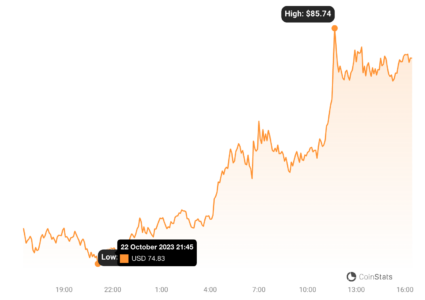
https://coinstats.app/coins/aave/
Both moving averages have initiated a turn upward, and the RSI is firmly entrenched in overbought territory, indicating a prevailing bullish advantage. As long as the price maintains its position above the descending trendline, the AAVE/USDT pair may potentially ascend to $88, with further aspirations extending to $95.