
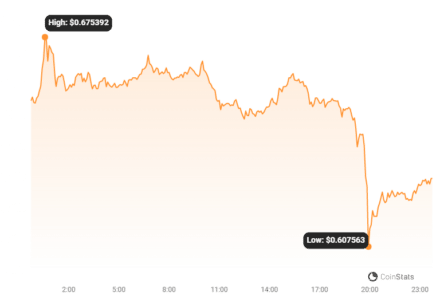
The price of XRP has decreased 5.83% over the past 24 hours to $0.61, continuing its downward trend over the past week of -5.0%, moving from $0.69 to its current price.
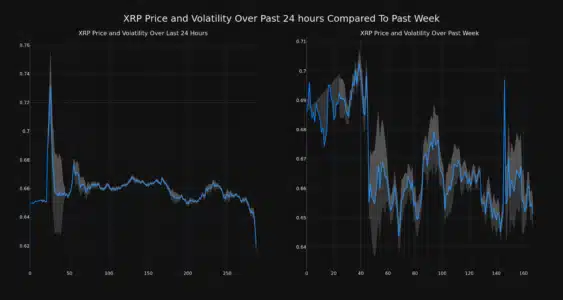
The chart below compares the price movement and volatility for XRP over the past 24 hours (left) to its price movement over the past week (right). The gray bands are Bollinger Bands, measuring the volatility for both the daily and weekly price movements.
Read Also: Fake ETF News On BlackRock Pushes Ripple XRP Up By 12%
The wider the bands are, or the larger the gray area is at any given moment, the larger the volatility.
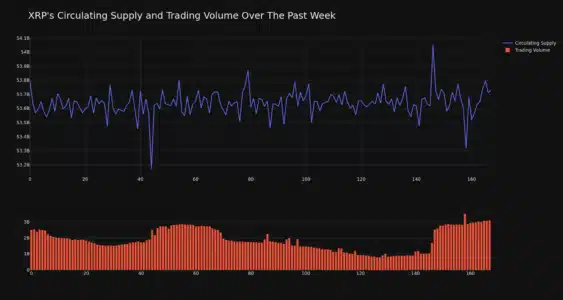
The trading volume for the coin has climbed 24.0% over the past week, moving opposite, directionally, with the overall circulating supply of the coin, which has decreased 0.12%. This brings the circulating supply to 53.65 billion, which makes up an estimated 53.65% of its max supply of 100.00 billion. According to our data, the current market cap ranking for XRP is #5 at $33.60 billion.
Disclaimer: The information provided is not trading advice. Bitcoinworld.co.in holds no liability for any investments made based on the information provided on this page. We strongly recommend independent research and/or consultation with a qualified professional before making any investment decisions.